Raygor Readability Estimate Graph Calculator
Give Rating
Raygor Estimate
Introduction & Description
The Raygor Readability Graph was formulated by Alton Raygor in 1977. He took inspiration from the Fry Graph since this readability formula is also graph-based. The main difference between the two lies in the variables used. While the Fry Graph uses syllable counting, the Raygor Readability formula uses letter counting.
The reason why Raygor used letter counting is that it takes less time to do it yields more accurate results. At the same time, letter counting is a better variable to use if you want better test-retest reliability.
You can think of the Raygor Readability Test like a mash-up of other popular tests, most notably the Fry Graph and the Automated Readability Test.
Formula
Calculating for the Raygor readability level of your text is quite simple. All you need to do is follow a few simple steps and plot points on the graph.
Step 1: Get a sample passage of 100 words from the text. If the text is long, take subsamples from the beginning, middle, and end. Don’t count numerals but include numbers.
Step 2: Count the total number of sentences in each passage. A half-sentence has a count of 0.5.
Step 3: Count the number of words in each passage with six or more letters.
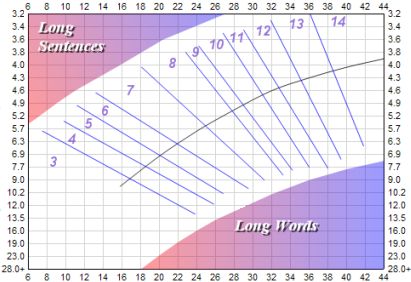
Step 4: Plot the answer from Step 2 on the graph. Plot the answer from Step 3 on the graph.
The place where the two points meet is the US grade level that your reader needs to have to understand your text. So if your answer for step 2 is 6.3 and your answer for Step 3 is 24, you’d get a Raygor readability level of 7, meaning 7th grade.
Grade Conversion
To help you plot your answers faster, here is an example of the Raygor Readability Graph. With this, you can easily see the estimated reading level your reader will need to understand your text.
Uses
The Raygor readability graph is mostly used for educational purposes since it can assess texts up to the college levels. However, it cannot be used for lower than middle school education since it doesn't go below third grade. As such, the Raygor readability graph is better suited for middle school level materials.
Readability in middle school is vital since it can make or break your kid’s willingness to read. Books that are too difficult to understand might bore your children, making reading seemed like a 'forced activity.'
So teachers, librarians, and parents need to make sure that they’re giving their kids the appropriate reading materials. Books and reading materials with the right level can be highly engaging and fun for your children.
The same idea goes for beyond middle school. By implementing the same things as your kids grow older, you can ensure that their willingness to keep reading continues as well.
How to Improve Score
Improving your score in the Raygor readability graph is quite simple, like the other readability formulas similar to it.
All you need to remember is to write simply. Less complex sentences will not confuse your readers and convey your message clearer. Simpler words will also improve your score. This test is better at accuracy because of letter counting as opposed to syllable counting. Words that are longer tend to be harder to understand. But not all words with multiple syllables are hard to understand.
You can also maximize the use of modern technology and use a Raygor readability calculator to assess your text, and edit accordingly.