Fry Graph Readability Calculator
Give Rating
Fry Graph Readability Tool
Introduction
Edward Fry formulated the Fry Readability Formula in 1968. Fry was a well-known expert in the reading industry and readability research. He is also an authority figure that supported the literacy development of countries outside of the United States.
Like many readability tests, Fry’s formula shows the US grade level required by a reader to have to understand a text. However, unlike the other readability test, Fry’s readability assessment is in graph form.
The Fry Readability Graph provides better accuracy in a less time-consuming means for educators and librarians. You can also use it alongside other readability tests such as the New Dale-Chall, Flesch Reading Ease, and Spache Readability Score.
Description
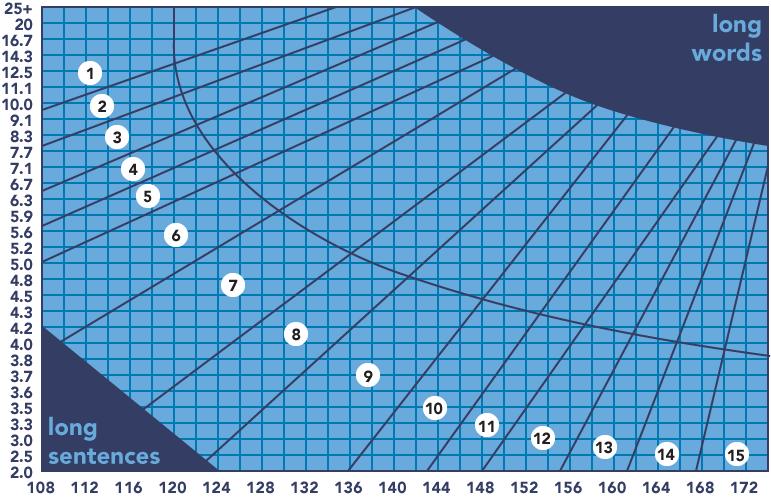
The Fry graph uses two variables, namely sentences and syllables. How to use the graph is relatively simple. You will need to get sample passages from your text, calculate for the number of sentences and syllables, and plot lines in the graph. Wherever the two dots intersect is the probable US grade level that the text requires.
Fry Formula
The Fry Readability Graph is quite easy to do, especially if you’re wary of mathematical equations. Many people can quickly make use of the Fry Graph in just a few simple steps.
Step 1: Get 3 sample passages of 100 words from the beginning, middle, and end of the text.
Step 2: Count the total number of sentences in the 3 passages, estimating to the nearest 1/10th of the last sentence. Find the average of all three numbers.
Step 3: Count the total number of syllables in the 3 passages. Add 100, and find the average of all three numbers.
Step 4: Plot on the graph the answer from Step 2. Plot on the graph the answer from Step 3.
Where the points meet will be your result, which says what US grade level a specific text scores. So if your text has an Average Sentence Length (ASL) of 4.5 and an Average Syllables per Word (ASW) of 136, then your US grade level score would be 8th Grade.
Grade Conversion
Below is a copy of the Fry Graph. It’ll help you get your results quicker.
Uses
The Fry Graph was primarily developed to aid in education, so it assesses elementary to college-level texts well. But like many readability tests, the Fry Graph can be used to assess texts from different industries, including but not limited to:
- Advertising
- Business
- Insurance
- Libraries
- Publishing
- Law and Government
- Healthcare
- Military
At the end of the day, the Fry Graph’s primary use is for clear communication. So you can use it to determine whether or not your text is understandable for your targeted audience.
How to Improve Score
As the Fry Graph is relatively similar to other formula-based readability tests, improving your scores is equally easy.
All you need to do is write in simple words and sentences—the less complicated your sentence, the clearer the message. Using conservational English also broadens the audience who can understand your text. So make use of everyday jargon for better clarity.
You can also use a Fry Readability Graph calculator to help you assess your text in real-time, and edit accordingly.